
In this post, I'll show you the process we go through to troubleshoot Feldera's performance. I'll show you how we inspect the internal dataflow graph for query execution, and how we sleuth around to diagnose and fix performance issues.
Let's look at one of the queries in Nexmark, a benchmark often used to compare the performance of streaming engine. In particular, I noticed that Nexmark query q12 ran very slowly: for 100 million input events, it took almost 3 minutes whereas most other queries took 20 to 60. This query was implemented as:
CREATE VIEW Q12 AS
SELECT
    B.bidder,
    count(*) as bid_count,
    TUMBLE_START(B.p_time, INTERVAL '10' SECOND) as starttime,
    TUMBLE_END(B.p_time, INTERVAL '10' SECOND) as endtime
FROM (SELECT *, NOW() as p_time FROM bid) B
GROUP BY B.bidder, TUMBLE(B.p_time, INTERVAL '10' SECOND);
This query is a simple query that only uses one table, the bid table, counting the bids that a user makes within fixed windows of processing time. I found this odd, because nothing here seemed like it should run slowly.
Profile Graphs
I ran the query again and, this time, I used the Feldera circuit_profile API to obtain a profile graph mid-run, retrieving it via a command like:
curl 'http://localhost:8080/v0/pipelines/nexmark-q9/circuit_profile' -H 'accept: application/zip' -o profile.zipThe profile.zip that this outputs visualizes how data flows through Feldera internally, with performance data for each worker thread. For this query, the profile for thread 0 looked like the one below, scaled down from the full profile. Each operator node is highlighted according to the amount of CPU time it used:

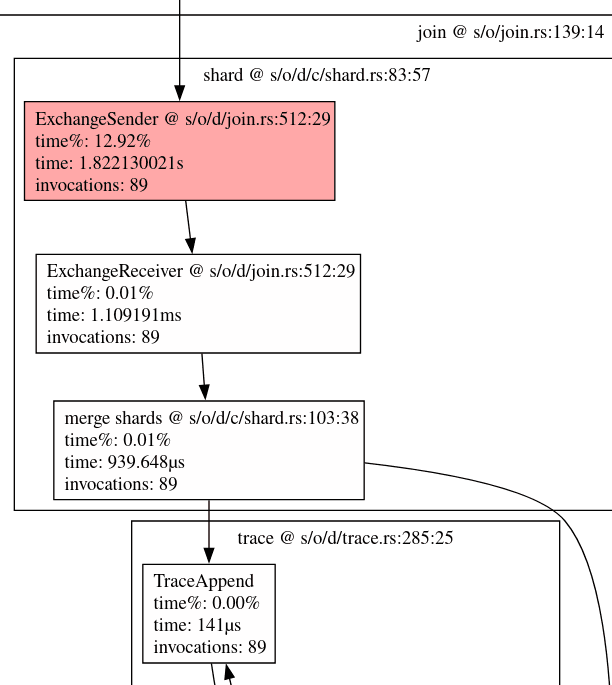
I noticed the bright red nodes in the middle and zoomed in on them, as shown below. A single join operation was consuming most of the runtime, over 78 + 16 = 94 seconds out of 114 seconds for the overall thread. That meant that any optimization would have to target that join operation in particular:

top
The profiles for the rest of the 16 worker threads also showed them being idle, like thread 1. To confirm that, I ran the top program for system monitoring and hit H so it would display threads instead of processes. As expected, it showed dbsp-worker-0 and its paired background thread dbsp-bg-0 as busy and the rest of the workers as idle:
    PID USER      PR  NI    VIRT    RES    SHR S  %CPU  %MEM     TIME+ COMMAND
  96202 blp       20   0   57.4g  23.1g  22716 R  99.0   9.2   1:08.98 dbsp-bg-0
  96219 blp       20   0   57.4g  23.1g  22716 R  98.7   9.2   1:45.15 dbsp-worker-0
  96251 blp       20   0   57.4g  23.1g  22716 S  18.1   9.2   0:14.30 nexmark-13
  96241 blp       20   0   57.4g  23.1g  22716 S  16.8   9.2   0:13.88 nexmark-3
  96243 blp       20   0   57.4g  23.1g  22716 S  16.5   9.2   0:13.16 nexmark-5
  96239 blp       20   0   57.4g  23.1g  22716 S  15.8   9.2   0:13.67 nexmark-1
  96249 blp       20   0   57.4g  23.1g  22716 S  15.8   9.2   0:12.94 nexmark-11
  96245 blp       20   0   57.4g  23.1g  22716 S  15.5   9.2   0:12.83 nexmark-7
  96247 blp       20   0   57.4g  23.1g  22716 R  15.5   9.2   0:13.18 nexmark-9
  96253 blp       20   0   57.4g  23.1g  22716 S  15.5   9.2   0:12.57 nexmark-15
  96242 blp       20   0   57.4g  23.1g  22716 S  14.8   9.2   0:11.97 nexmark-4
  96248 blp       20   0   57.4g  23.1g  22716 S  14.8   9.2   0:12.12 nexmark-10
  96238 blp       20   0   57.4g  23.1g  22716 S  14.5   9.2   0:12.04 nexmark-0
  96240 blp       20   0   57.4g  23.1g  22716 S  14.5   9.2   0:12.10 nexmark-2
  96244 blp       20   0   57.4g  23.1g  22716 S  14.5   9.2   0:11.95 nexmark-6
  96246 blp       20   0   57.4g  23.1g  22716 S  14.5   9.2   0:12.95 nexmark-8
  96250 blp       20   0   57.4g  23.1g  22716 S  14.2   9.2   0:11.91 nexmark-12
  96252 blp       20   0   57.4g  23.1g  22716 S  14.2   9.2   0:11.72 nexmark-14
  96225 blp       20   0   57.4g  23.1g  22716 S  13.5   9.2   0:10.40 dbsp-worker-6
  96226 blp       20   0   57.4g  23.1g  22716 S  13.5   9.2   0:10.38 dbsp-worker-7
  96231 blp       20   0   57.4g  23.1g  22716 S  13.5   9.2   0:10.55 dbsp-worker-11
  96221 blp       20   0   57.4g  23.1g  22716 S  13.2   9.2   0:10.42 dbsp-worker-2
  96227 blp       20   0   57.4g  23.1g  22716 S  13.2   9.2   0:10.70 dbsp-worker-8
  96229 blp       20   0   57.4g  23.1g  22716 S  13.2   9.2   0:10.41 dbsp-worker-9
  96233 blp       20   0   57.4g  23.1g  22716 S  13.2   9.2   0:10.35 dbsp-worker-13
  96235 blp       20   0   57.4g  23.1g  22716 S  13.2   9.2   0:10.67 dbsp-worker-15
  96220 blp       20   0   57.4g  23.1g  22716 S  12.9   9.2   0:10.35 dbsp-worker-1
  96222 blp       20   0   57.4g  23.1g  22716 S  12.9   9.2   0:10.23 dbsp-worker-3
  96230 blp       20   0   57.4g  23.1g  22716 S  12.9   9.2   0:10.52 dbsp-worker-10
  96232 blp       20   0   57.4g  23.1g  22716 S  12.9   9.2   0:10.46 dbsp-worker-12
  96234 blp       20   0   57.4g  23.1g  22716 S  12.9   9.2   0:10.41 dbsp-worker-14
  96223 blp       20   0   57.4g  23.1g  22716 S  12.6   9.2   0:10.35 dbsp-worker-4
  96224 blp       20   0   57.4g  23.1g  22716 S  12.6   9.2   0:10.43 dbsp-worker-5
Key Distribution
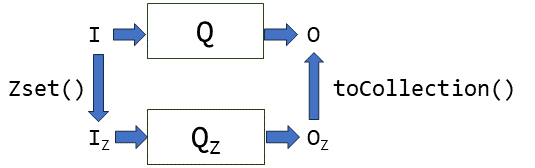
Once confirmed, I puzzled over why one thread would be processing all 100 million records and the others none of them. Feldera executes inner joins via "sharding": it computes a hash of the fields used for the join and evenly distributes the records among the worker threads based on the hash. For 16 worker threads, each thread should process one-sixteenth of the records, if the join fields themselves have a uniform distribution.
Maybe the fields being joined were not evenly distributed? If the data being input to a join has a very skewed distribution, for example if the join fields take fewer values than there are worker threads, or if one or a few values of the join fields are associated with the bulk of the records, then this approach to a join will not perform well because one or a few threads would do all of the work.
What fields are being joined in this case? The profile does not say directly, but it references the Rust code generated by the Feldera SQL compiler. I looked at the code that generated one input to the join:
// rel#59:LogicalProject.(input=LogicalTableScan#1,exprs=[$1, $TUMBLE(NOW(), 10000:INTERVAL SECOND)])
// DBSPMapIndexOperator 2812(575)
let stream2812: Stream<_, IndexedWSet<Tup0, Tup7<Option<i64>, Option<i64>, Option<i64>, Option<String>, Option<String>, Timestamp, Option<String>>>> = stream2779.map_index(move |t_8: &Tup7<Option<i64>, Option<i64>, Option<i64>, Option<String>, Option<String>, Timestamp, Option<String>>, | ->
(Tup0, Tup7<Option<i64>, Option<i64>, Option<i64>, Option<String>, Option<String>, Timestamp, Option<String>>, ) {
    (Tup0::new(), (*t_8).clone(), )
});
This code lists the types very explicitly, which makes the code harder to read. With types removed and the code rephrased slightly, this is essentially:
let output = input.map_index(|x| ((), x));This means that the join fields are `(), the empty tuple. In other words, the implementation of q12 was using a constant value as the join field. A constant value always hashes to the same value, which in turn meant that all of the data in the join was being processed in a single thread, leading to the behavior that we observed.
Solution
The preceding analysis pointed to the SQL compiler's interpretation ofthe query, which was outside my area of expertise, so I passed it along to Mihai, our SQL implementation expert, by filing issue 2229. Mihai determined that [the SQL for the query was wrong] and provided a fix that updated the query's SQL.
Mihai's fix was based on the observation that the query's use of the SQL `now()` function, which reports the current time, was not correct in the context of the query. The query was supposed to be written in terms of the time that the record was originally received, which is better approximated using the record's own date and time than with the current time.
With Mihai's fix, the join that caused trouble is no longer in the generated code at all. The result is that `q12` performance improved from almost 3 minutes to about 20 seconds for 100 million input events, changing it from an outlier to among the fastest Nexmark queries.
Conclusion
This blog entry explored some of the tools that can be useful for
exploring the details of Feldera's performance and described their use
for debugging one particular performance problem.